Survey: Nearly one-third of Americans dealing with lower income due to coronavirus outbreak

The Bankrate promise
At Bankrate we strive to help you make smarter financial decisions. While we adhere to strict , this post may contain references to products from our partners. Here's an explanation for .
The coronavirus crisis is having a profound impact on the financial lives of Americans, despite the efforts by many to cut back on spending.
Since the outbreak began, 30 percent of respondents say they’ve experienced a decrease in household income, according to a new Bankrate survey. About 1 in 5 workers has applied for unemployment since March 13, and the unemployment rate surged to 14.7 percent in April. Under government orders, many non-essential businesses were forced to close. It’s feared that a great deal of them may never end up reopening, dampening the hopes of a quick economic recovery.
“The pandemic is deepening the financial hardship for millions of Americans,” says Greg McBride, CFA and Bankrate chief financial analyst. “Nearly one-third of households report lower income since the start of the pandemic, with half of those same households now having more debt and they are three times as likely to have seen their emergency savings also decline.”
Bankrate asked 2,653 Americans about their debt (mortgage, auto, credit card, personal loan and student loan), emergency savings and household income. Below are the key findings from the survey.
Key takeaways:
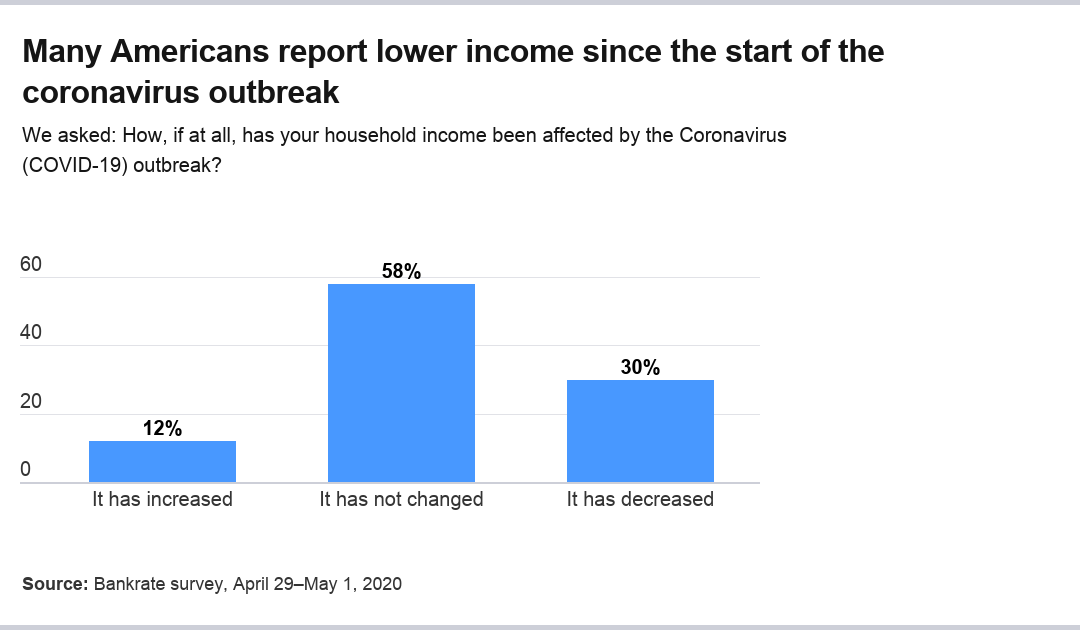
- About 30 percent of Americans have reported a decline in income, while only 12 percent say they’ve seen an increase since the COVID-19 outbreak started.
- Nearly one in five respondents said their emergency savings fell.
- Around 16 percent of Americans have increased their debt.
A sizable portion of Americans are seeing lower income
About two months into the coronavirus crisis, Americans have really felt the effects on their income. About 30 percent of respondents said their income had declined since the crisis began, while 58 percent say the crisis has not affected their income. Surprisingly, 12 percent say their income has increased.
“The financial legacy of this pandemic will be elevated unemployment, reduced household incomes, more debt and even less savings,” says McBride.
The crisis affected all age groups surveyed, with each generation more likely to report a decrease in income rather than an increase. Younger workers were more likely to have experienced a decline in income than older generations.
- Nearly 43 percent of Generation Z (ages 18-23) saw income decline, against 10 percent who saw an increase.
- More than 32 percent of millennials (ages 24-39) saw income decline, against 18 percent with a rise.
- About 35 percent of Generation X (ages 40-55) saw incomes decline, compared to 8 percent who experienced a gain.
- Around 25 percent of boomers (ages 56-74) saw income fall, compared to 9 percent with an increase.
- Around 13 percent of the Silent Generation (ages 75+) saw a fall income, against about 7 percent with a rise.
For many people, unemployment benefits don’t begin to make up for lost wages.
Age was also associated with a higher likelihood of no change in income. More than 47 percent of Generation Z reported that their income stayed the same, compared to millennials (49 percent), Generation X (57 percent), boomers (66 percent) and the Silent Generation (80 percent).
However, the crisis seems to hit income groups at largely the same rate. The likelihood of change in income – either up or down – differed little among income groups, ranging between 56 and 59 percent.
Many Americans seem to be using a higher income to increase their emergency savings. Of those who earned more, 48 percent have boosted their savings. Even those with the same income have increased their emergency fund, with about 18 percent reporting more savings. And of those whose incomes have declined, 9 percent have managed to save more.
Surprisingly, a change in income didn’t seem to have much impact on debt loads.
- Almost 32 percent of those with higher income reported having increased debt, while only 14 percent of this group decreased their debt. About 15 percent had no debt then or now.
- More than 7 percent of those with the same income reported increased debt, while 13 percent said they had reduced their debt. Almost 24 percent reported no debt then or now.
- For those with a decreased income, about 26 percent have taken on more debt, while 8 percent have less debt, and 20 percent report no debt then or now.
So while higher income during the crisis is associated with higher emergency savings, it’s also associated with having more debt.
Emergency savings both rose and fell, depending on the group
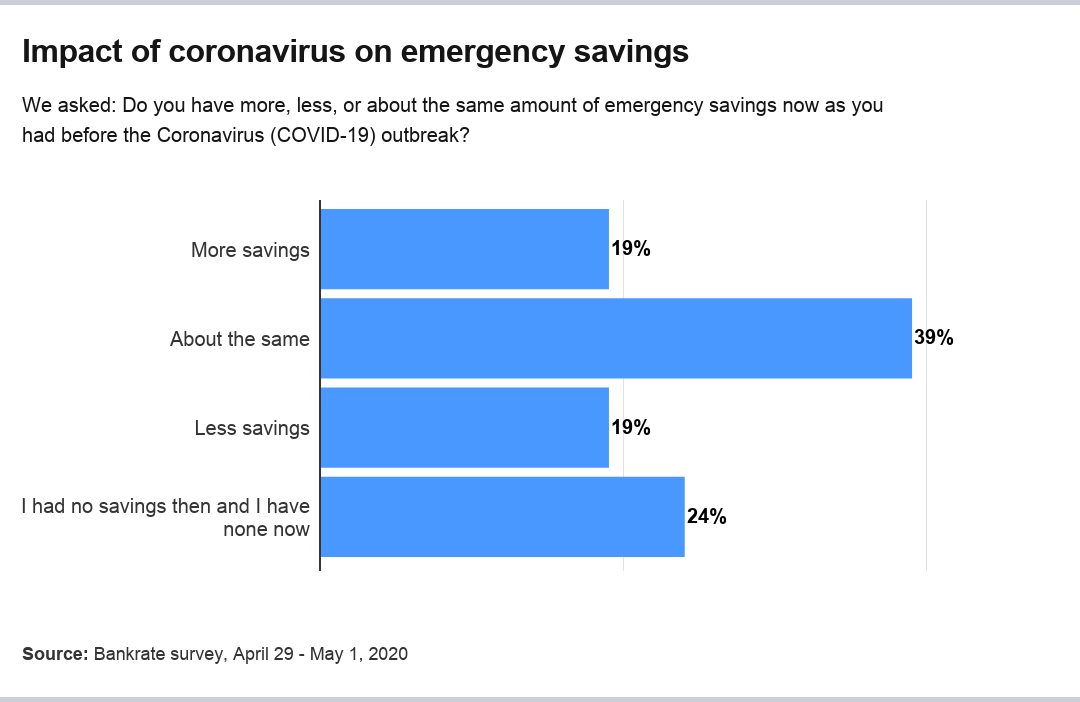
Americans had varied responses in regard to their emergency savings. Overall, 19 percent of respondents said they have more savings now than before the crisis, 19 percent have less and 39 percent have about the same. Almost 24 percent said they had no savings before the outbreak or none currently. The highest-yielding savings accounts are typically found online.
Almost 20 percent of households with emergency savings have added debt since the crisis began, compared to 31 percent of those with less savings since the outbreak started.
Those households with increased emergency savings were more than three times as likely to have paid down debt than those with decreased emergency savings (22 percent to 7 percent).
Emergency savings by age group differed significantly at times. Millennials were the most likely age group to have saved more at 24 percent, against 17 percent of this group with decreased savings. Only the Silent Generation was less likely, at 11 percent, to report lower savings.
Here’s how emergency savings at other age groups changed:
- In Generation Z, 17 percent of respondents saved more, while 20 percent saved less.
- In Generation X, 19 percent saved more, against 21 percent that saved less.
- Among boomers, 14 percent increased their savings, while 20 percent saw savings fall.
- Among the Silent Generation, 16 percent increased their savings, while 11 percent saw their emergency savings fall.
Millennials and the Silent Generation were the only age groups more likely to have increased emergency savings than to have decreased savings.
Generation Z (35 percent) and Generation X (27 percent) were the most likely age groups to report no emergency savings before the crisis or now.
Increased emergency savings rose consistently with higher incomes.
- More than 13 percent of those earning less than $30,000 reported increased savings.
- About 20 percent of those earning between $30,000 and $49,999 reported more savings.
- Nearly 21 percent of those earning between $50,000 and $79,999 said their emergency savings had grown.
- More than 27 percent of those earning greater than $80,000 said savings had risen.
Surprisingly, the income group most likely to see decreasing emergency savings was not the lowest income group, but rather those earning between $30,000 and $49,999 annually.
Debt has increased for many Americans
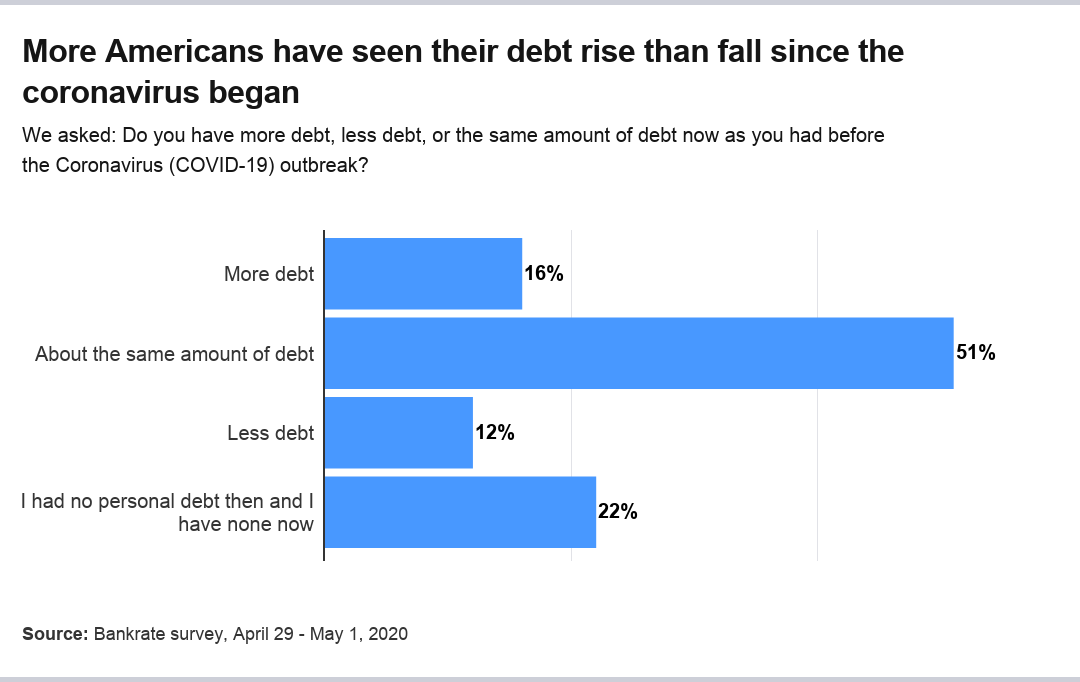
Overall, since the pandemic started, 16 percent of Americans say they have more debt now than before. About 12 percent have less debt and 51 percent have about the same. Nearly 22 percent say they had no debt before and have none now.
Households that have increased debt since the outbreak are more likely to have less emergency savings (36 percent) now than more savings (24 percent). Those with less debt were more than three times more likely to have boosted emergency savings (36 percent) than to have less emergency savings (11 percent).
Age 55 is a break point in the tendency toward more or less debt since the outbreak. Younger groups (Generation Z, millennials, Generation X) were more likely to increase debt loads, while older ones were balanced between having more or less debt (younger boomers) and having less debt (older boomers and the Silent Generation).
The tendency to have increased debt was not materially different by income, while the tendency to have paid down debt did increase with higher income.
Among the 2,082 households with debt, here is how that breaks down by loan type:
Mortgage debt
Mortgage debt has not changed substantially since the crisis has begun:
- About 6 percent of respondents have more debt.
- More than 10 percent have less debt.
- More than 34 percent have about the same debt.
- Almost 50 percent report having no mortgage debt.
Only a slight majority of millennials and Generation X have mortgage debt, while more than half of boomers (51 percent), Silent Generation (53 percent) and Generation Z (63 percent) do not have mortgage debt.
The tendency to have increased mortgage debt since the outbreak is higher among Generation Z (14 percent) and millennials (10 percent) than older age groups.
While there is no material difference between income groups when it comes to increased mortgage debt, the likelihood to have reduced mortgage debt increases as income increases.
Auto debt
Auto loan debt remains much the same as before the crisis:
- Almost 6 percent of respondents say they have more auto debt.
- About 12 percent have less debt.
- Nearly 31 percent say their debt is about the same.
- Almost 52 percent say they did not or do not have debt.
Only a slight majority of millennials and Generation X report having auto debt, while more than half of Generation Z, boomers, and Silent Generation do not have auto debt.
The tendency to have increased auto debt is not materially different between income groups. However, the highest earners ($80,000 a year or more) are twice as likely to have reduced their auto loan debt since the outbreak as those earning $30,000 a year or less (16 percent versus 8 percent).
Credit card debt
Credit card debt has swung both higher and lower since the crisis began:
- About 17 percent of respondents said they had more credit card debt.
- Almost 18 percent said they had less credit card debt.
- Nearly 44 percent reported having about the same amount of debt.
- More than 21 percent reported they had no card debt.
A majority of all generations have credit card debt. Younger generations tended to have increased debt, while older generations tended to have reduced debt.
The tendency to have more credit card debt since the outbreak is only slightly higher for households with income below $50,000 per year than those with incomes above that level. The tendency to have less credit card debt now is only slightly higher for households with income of $50,000 per year or more.
Personal loan debt
Personal loan debt remains much the same as before the coronavirus crisis:
- About 8 percent report they have more personal loan debt.
- Nearly 9 percent say they have less debt.
- More than 20 percent have the same debt.
- More than 63 percent report no personal loan debt.
At more than 50 percent, millennials report the highest rate of personal loan debt, while the majority of other groups do not, including Generation Z (62 percent), Generation X (65 percent), boomers (71 percent) and the Silent Generation (78 percent).
Student loan debt
Student loan debt remains similar to before the coronavirus crisis:
- More than 5 percent of respondents say they have more student loan debt.
- More than 4 percent report having less student loan debt.
- Almost 22 percent say they have about the same debt.
- About 69 percent say they have no student loan debt.
Generation Z (72 percent) and millennials (52 percent) report the highest rates of student loan debt, while the overwhelming majority of Generation X (71 percent), boomers (89 percent) and the Silent Generation (96 percent) report no such debt.
Methodology
This study was conducted for Bankrate via online interview by YouGov. Interviews were conducted from April 29 – May 1, 2020 among a sample of 2,653 adults. Data are weighted and are intended to be representative of all U.S. adults, and therefore are subject to statistical errors typically associated with sample-based information.
Related Articles

Survey: More than two-fifths of households say income hasn’t recovered from initial coronavirus hit

Millions of Americans entered coronavirus pandemic with credit card debt

Survey: Scary percentage of Americans financially unprepared for recession

Adding it up: Here’s how much Americans spend on financial vices